Energy crisis update: Wholesale electricity prices more than doubled during Q1 2017
April 14, 2017

Extreme summer heat combined with energy crisis factors such as high gas prices, outdated market rules and a lack of competition, have produced extraordinary wholesale electricity pricing throughout the first quarter (Jan to Mar) of 2017 across the National Electricity Market (NEM). At $173.19/MWh, Queensland had the highest average pool price over the quarter (see Figure 1). This was more than $46/MWh (or 36%) higher than the next most expensive state, South Australia.

New South Wales had the highest percentage increase compared with Q1 2016 at 170%, followed by South Australia at 160%. Tasmania experienced very high pricing back in Q1 2016 due to a fault at the Basslink HVDC cable link, which connects Victoria to Tasmania, and record low storage levels in the hydroelectric system. The interconnector has since been restored to service and hence Tasmania was the only state to see a price decrease in Q1 2017 compared to Q1 2016.
In a previous article, I flagged that QLD’s average price of $197.65/MWh during January 2017 set a new record for the state. However, this was swiftly exceeded in February 2017, which had an average price of $239.60/MWh.
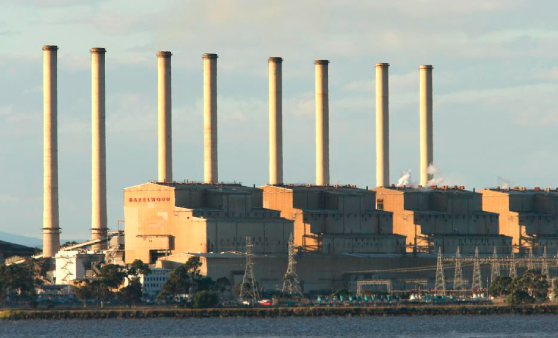
Victorian wholesale prices were the cheapest during the quarter but this is unlikely to last. The closure of Hazelwood Power Station in late March is highly likely to increase volatility in the Victorian market during the transition period.
Some people might be wondering how the emissions intensity of the grid has changed over the period shown in Figure 1. The Carbon Dioxide Equivalent Intensity Index calculates the tonnes of carbon dioxide equivalents that are emitted into the atmosphere for each megawatt hour of electricity that is produced. The Index for the first quarter of the last three years is shown in Figure 2. All states have remained relatively consistent with the exception of South Australia, which reduced its emissions intensity by 37% compared to Q1 2016.

During Q1 2017, the average emissions intensity across the entire NEM was 0.92 t CO2-e/MWh. Victoria had the highest state wide emissions intensity of 1.21 t CO2-e/MWh. We can expect this number to go down following the closure of Australia’s dirtiest power station, Hazelwood. Tasmania, which is predominately hydro powered, had the lowest emissions intensity of 0.13 t CO2-e/MWh.
The next question one might ask is what can energy users do to control their electricity costs in such extreme conditions. Much of the focus from the media and our politicians has been limited to supply side solutions. However, there are many demand side strategies, such as demand response, self generation, energy efficiency and more effective procurement and contract negotiation, that energy users can implement relatively quickly to drastically reduce their power costs and help mitigate future risks. Feel free to reach out to Energy Synapse if you want to have a more in depth discussion about what solutions might be appropriate for your business.
*All wholesale pricing data obtained from AEMO.
Author: Marija Petkovic, Founder & Managing Director of Energy Synapse
Follow Marija on LinkedIn | Twitter