Victorian energy users without a bold plan will be in big trouble following Hazelwood closure
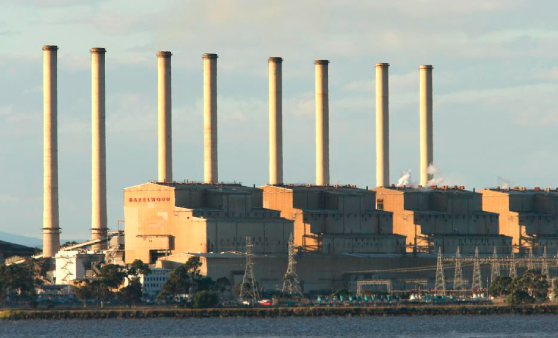
Hazelwood, a brown coal-fired power station located in the Latrobe Valley in Victoria, is scheduled to progressively close down from the 24th to the 29th of March 2017. It was built between 1964 and 1971 and with an emissions intensity of 1.52 tCO2/MWh, it is the most carbon polluting power station in Australia and one of the worst in the world. In 2016 alone, Hazelwood emitted 15.5 million tonnes of CO2 into the atmosphere. Its imminent closure is a big win for the environment and certainly a necessary step in decarbonising Australia’s electricity grid.
However, the transition period following Hazelwood’s closure is likely to have big price impacts on Victorian energy users, most of all those who are unprepared for the changes. Hazelwood represents about 12% of Victoria’s available generation and the sudden departure of this cheap power source is likely to create big upward movements in the wholesale electricity market. Electricity futures have already been pricing in this risk for some time but just what kind of impact might we see in the spot market?

Generators place bids into the market that specify how many megawatts of power they are willing to supply at certain price points. The market then selects the lowest cost generation (given constraints) to serve demand during each dispatch interval. Figure 1 shows the average of the 5 minute generator bids during 2016 for Victoria as a total and then just for the Hazelwood Power Station. Hazelwood has been bidding nearly all of its output at a price less than or equal to $0/MWh. The closure of Hazelwood will act to remove an average of 1160 MW from the cheapest rung in the bid stack.
During 2016, the 30 minute Victorian spot price did not reach the $10,000/ MWh mark. However, if we eliminate Hazelwood from the equation, pricing had the potential to be in the $10,000-14,000/MWh range up to 10% of the time. In reality, peaking generators would most likely upwardly adjust their expectations regarding how many hours they will run and hence could lower their bid prices while maintaining current profitability levels. As we can see from Figure 1, bidding in the $1,000-10,000/MWh range was almost non-existent so we might see some of the red zone bids coming down into this bracket. Either way, significantly higher volatility is almost certain.
Fortunately, with great volatility comes great opportunity. Forward thinking energy users will be able leap ahead of competitors while others risk falling further behind in an already difficult environment. If you would rather be in the former camp, contact Energy Synapse and we will help you navigate the changes.
*Raw carbon, generation and bidding data from NemSight.
Author: Marija Petkovic, Founder & Managing Director of Energy Synapse
Follow Marija on LinkedIn | Twitter
Small solar owners saved the NSW electricity market $888 million during heatwave
New South Wales recently experienced a severe heatwave, which saw parts of the state exceed 45°C. These extreme conditions put significant strain on the electricity market from the 9th to the 11th of February 2017.
During this three day period, small solar PV (i.e. PV systems that are not registered as generators in the NEM), generated about 17 GWh of power. This was 2% of the state’s total power needs. If we match up small solar generation with the wholesale price in the NSW market, we can see that small solar was worth about $9.6 million, or $550/MWh. However, a small solar owner is lucky to receive 8 c/kWh or $80/ MWh as a feed-in tariff.
The story of the value of small solar during the heatwave doesn’t stop there. The interesting question to me was how would the electricity market cope if there was no small solar. This is difficult to quantify, but my attempt considered three factors:
- What would electricity demand in NSW look like if the generation from small solar had to be met by the market. Data published by the Australian PV Institute was used for this analysis.
- Given this new demand profile, what would the 30 min electricity price be in the wholesale market. To develop the likely set of prices without small solar, the 5 min bid stacks published by AEMO were examined for each period where small solar was generating power.
- What would be the cost to the market with small solar (i.e. the actual cost that was incurred) vs the cost without small solar (i.e. the estimate derived from 1 & 2).
Figure 1 shows the data for the 9-11 Feb 2017 study period. The light green shading shows the actual electricity demand that was seen by the market. The dark green shading shows the estimated generation from small solar PV. The effect of small solar was to reduce the length of peak demand and to push the peak to later in the afternoon.

The black line is the actual 30 min pool price that was seen in the NSW wholesale market. The grey line is the pricing that would have resulted if the power generated by small solar had to be met by the market, assuming that bidding behaviour remained the same. Under these conditions, the effect of small solar was to significantly depress pricing in the wholesale market. Furthermore, it is likely that AEMO would have called for involuntary load shedding during the afternoon of Friday 10 Feb, as there were periods with not enough generation bids to meet the extra demand that small solar was covering.
The final consideration is the total cost impact to the market with and without small solar. In part 2, we derived the likely pricing without small solar. However, it is not just the solar portion of demand that would be subject to this new pricing. The way that the NEM is settled means that the entire demand in the state for a given 30 min trading interval would be subject to the new 30 min price. Figure 2 shows the daily electricity cost in the NSW wholesale market with small solar (i.e. the actual costs incurred by market participants) and without small solar (derived from our analysis).

Over the three day period, small solar reduced the cost to the market by roughly $888 million. Even though small solar only covered 2% of electricity demand, it cut the price of electricity by 60% from an estimated volume weighted average price of $1920/MWh to $780/MWh.
Author: Marija Petkovic, Founder & Managing Director of Energy Synapse
Follow Marija on LinkedIn | Twitter