Emissions intensity of NEM below carbon tax levels for 6th consecutive month
November 17, 2017
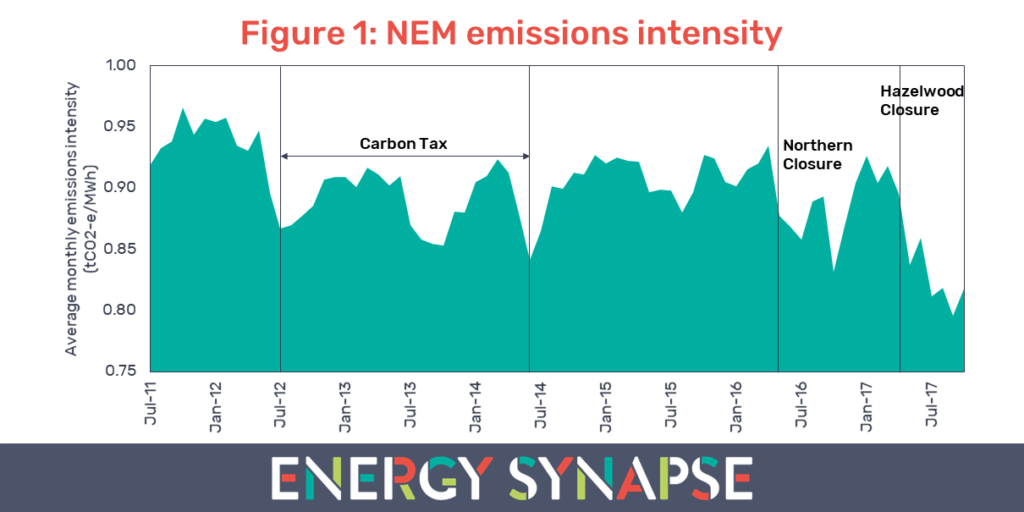
October 2017 marked the 6th consecutive month where the emissions intensity of the National Electricity Market (NEM) was below the average level during the carbon tax. Emissions intensity is a measure of how many tonnes of carbon dioxide equivalents (tCO2-e) are emitted for each megawatt hour (MWh) of electricity that is produced. Figure 1 shows the average monthly emissions intensity of the NEM from June 2011 to October 2017. The data has been compiled from AEMO publications*.
Effect of the carbon tax on emissions
The carbon tax was in force in Australia from 1 July 2012 to 30 June 2014. It started at a price of $23/tonne in FY 2012-13 and increased to $24.15/tonne in FY 2013-14 before being repealed by the Abbott Government.
The carbon tax had a significant impact on curbing carbon in the electricity sector. The average emissions intensity of the NEM during the carbon tax period was 7% lower than the average in the 12 months prior to its implementation (0.87 tCO2-e/MWh, down from 0.93 tCO2-e/MWh). Unfortunately, emissions crept back up to almost pre-carbon tax levels after the carbon tax was repealed.
Renewable energy growth and the exit of coal
Electricity generation from renewable sources in the NEM has grown by over 50% from approximately 25,000 GWh in 2011 to 39,000 GWh in 2016**. As a percentage of total generation, this represents an increase from 12% to 18%. This growth has been an important factor in helping to control emissions in the NEM. However, it is the exit of major coal fired power stations that has resulted in the very sharp decreases in carbon intensity that we see in Figure 1. Firstly, Northern, a 520 MW black coal power station in Port Augusta, SA, was permanently closed in May 2016. This was the last coal fired power station in South Australia. Secondly, Hazelwood, a 1,600 MW brown coal power station in Victoria, closed at the end of March 2017. Hazelwood was not only Australia’s dirtiest power station, but also one of the worst in the OECD.
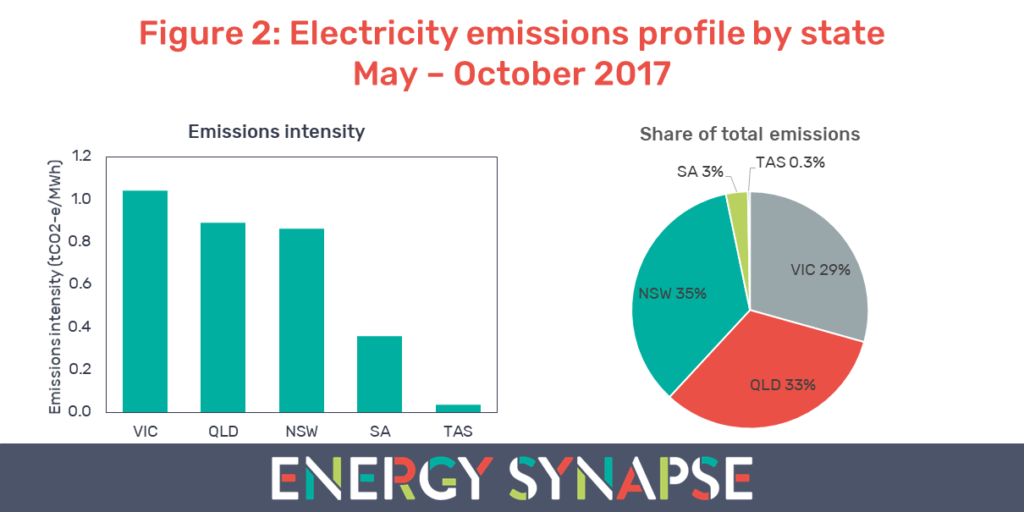
Despite the closure of Hazelwood, Victoria still has the highest emissions intensity in the NEM. Figure 2 shows the carbon emissions profile for each state, in terms of both intensity and absolute figures, over the last six months. The renewable heavy states of South Australia and Tasmania lead the NEM on both emissions measures.
It is evident that the closure of coal-fired power stations will be a critical step in decarbonising Australia’s electricity sector. A stable policy framework will be essential in fostering an orderly and efficient transition.
*From 1 June 2014 onward, AEMO changed the methodology for calculating emissions data from estimated to actual data (from NGER). We have adjusted the pre-June 2014 data to reflect the change in methodology as per AEMO’s impact assessment.
**Australian Energy Statistics published by the Department of Energy and Environment.
Author: Marija Petkovic, Founder & Managing Director of Energy Synapse
Follow Marija on LinkedIn | Twitter