QLD smashes electricity demand record during heatwave but narrowly avoids high pricing
February 27, 2018

Midway through February 2018, Queenslanders sweltered through a severe heatwave, which saw statewide average temperatures exceed 40°C for several days. These extreme conditions resulted in electricity demand in QLD exceeding the 9,400 MW threshold for the first time ever. Not just once, but four days in a row starting from Monday the 12th of February (see Figure 1).
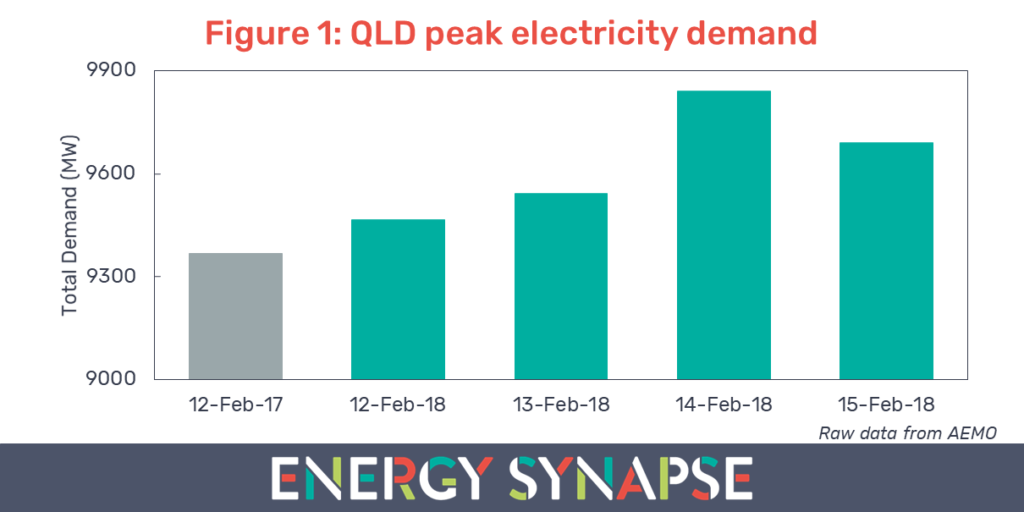
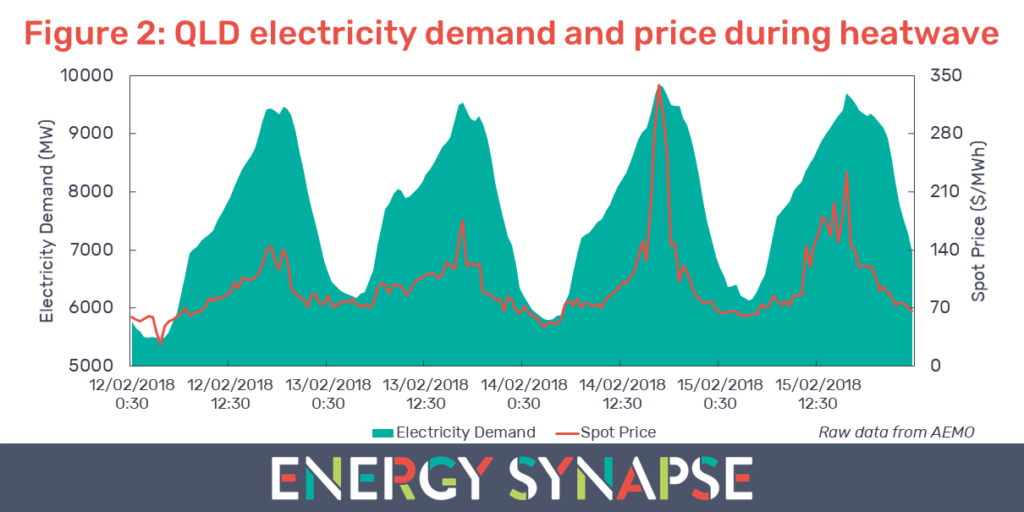
The previous record for the highest ever electricity demand was 9,369 MW and was set on 12 February 2017. This figure was eclipsed during the 5pm trading interval on 14 February 2018 when total demand reached 9,840 MW. During this time, the Australian Energy Market Operator (AEMO) had also declared an actual lack of reserve (LOR 1) event for QLD. Despite these record breaking levels of demand, the 30 minute spot price remained at relatively modest levels below $350/MWh over the four days (see Figure 2).
Some might look at this modest pricing and conclude that QLD was a long way away from reaching $10,000/MWh. However, this could not be further from the truth. In order to understand just how close the market was to a price spike, we need to examine the generator bidstack.
Generator bidding data shows QLD narrowly escaped extreme pricing
The dispatch process is complicated but to put it in very simple terms: generators submit bids to AEMO for each five minute dispatch interval, signalling how much electricity they are willing to provide and at what price. AEMO’s central dispatch process then orders these bids from least to most expensive. The least cost generators (taking into account constraints) are dispatched to serve the demand in the market. The marginal bid (i.e. the last/highest cost generator that is selected) sets the price for everyone in that dispatch interval. The bidstack changes every five minutes depending on market conditions and generator bidding behaviour.
The data sets that contain the bidding information for the National Electricity Market (NEM) are notoriously difficult to access and work with. For this purpose, we use a very nifty software package from Creative Analytics (part of the Energy One group) called NemSight. NemSight allows us to extract relevant bidding data with ease and in an intuitive, easy to understand format.
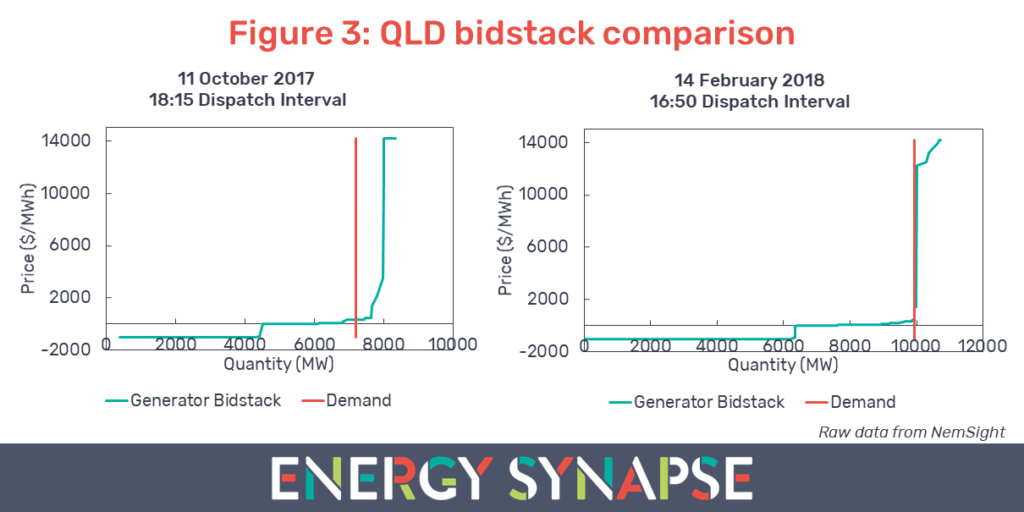
For our exercise, we have extracted the bidding data for two days: 11 October 2017 and 14 February 2018. These two days were very similar in terms of price outcomes. The 30 minute spot price peaked at $259/MWh on 11 October 2017 compared with $338/MWh on 14 February 2018. Furthermore, both days had a similar average daily price ($115/MWh on 11 October compared with $105/MWh on 14 February). Despite these similarities, the bidding data tells a very different story in terms of how close each of these days came to a price spike.
Figure 3 shows a comparison of the generator bidstack for each day. We have shown the dispatch interval where pricing was the closest to spiking on each respective day. The regional bidstacks (in teal) have been adjusted to account for constraints and imports via the interconnectors. In red, we have the corresponding electricity demand for that particular dispatch interval. The data shows that 11 October 2017 was more than 600 MW away from reaching price levels greater than $10,000/MWh. In contrast, 14 February 2018 was a knife’s edge away from very high pricing with very little room for things to go wrong in the market. QLD energy consumers were very lucky to walk away from the heatwave relatively unscathed.
Coal and gas generators were less available when needed the most
In addition to the static snapshot in Figure 3, we also examined how the bidding behaviour of QLD generators evolved on 14 February 2018. The video below is an animation from NemSight. It shows how the volume offered, and the price at which it was offered, changed throughout the day. The interesting thing to note is the dropping availability in the afternoon, which pushes prices closer to the brown zone (>$10,000/MWh).
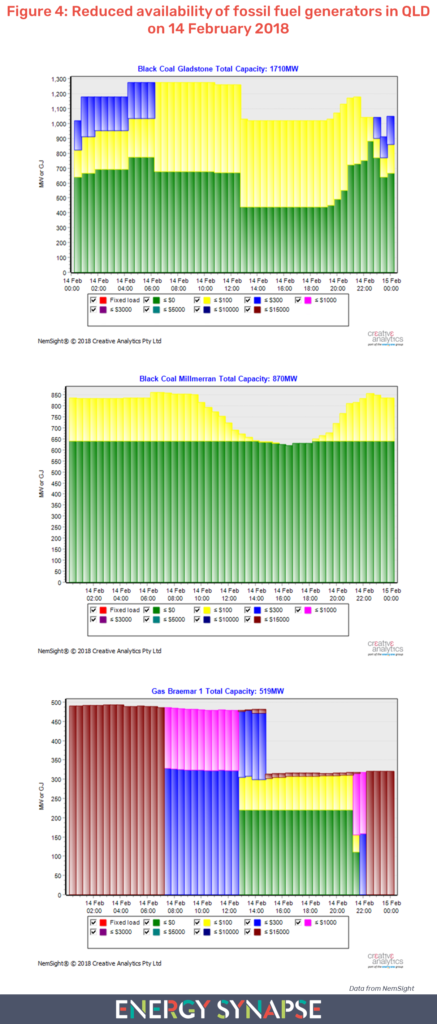
This reduction in availability was predominately due to Gladstone (black coal), Millmerran (black coal), and Braemar 1 (gas) as shown in Figure 4. These fossil fuel generators lost availability when needed the most in the late afternoon. This raises several questions for policy makers. In particular, what portion of fossil fuel capacity can reliably meet peak demand?
If there is one thing that our analysis here has shown, it is that when it comes to the energy market, there is almost always more than meets the eye. This highlights the need to understand underlying market dynamics rather than relying on conventional wisdom or incomplete data to make decisions. This is more important now than ever as we enter an unprecedented transformation of the electricity sector.
Author: Marija Petkovic, Founder & Managing Director of Energy Synapse
Follow Marija on LinkedIn | Twitter