National Electricity Market year in review part 2/2: Changing energy mix
January 18, 2019
Share
In the second installment of our National Electricity Market (NEM) Year in Review series, we will be looking at how the energy mix has evolved over the past year.
If you missed part one, we examined the major events that shaped wholesale electricity prices during 2018.
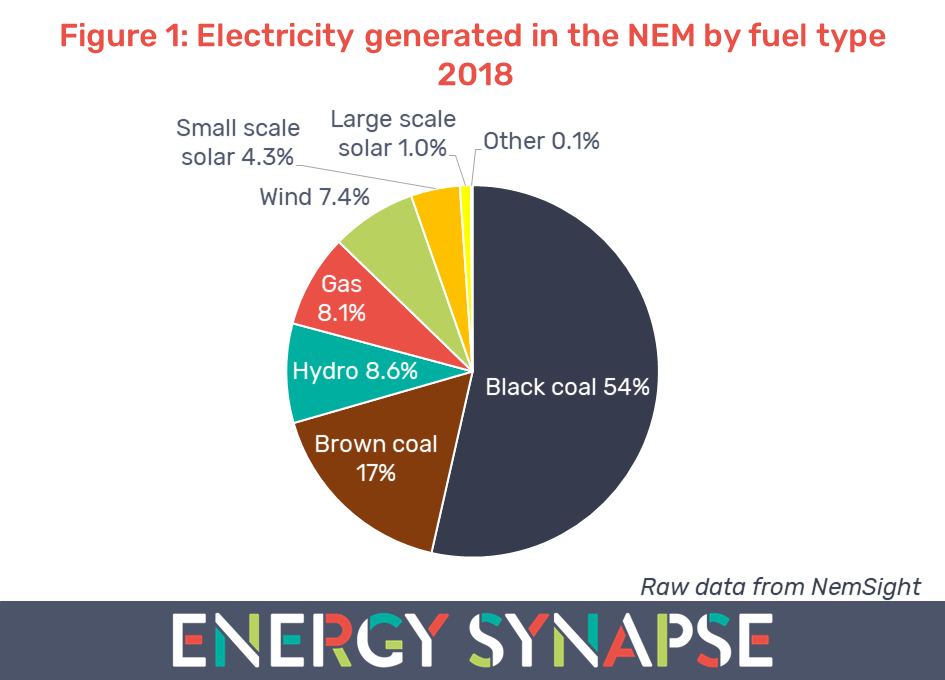
Figure 1 shows the percentage of electricity generated in the NEM by each fuel type. This data has been compiled using NemSight, a software developed by Creative Analytics (part of the Energy One group). Note that we have included generation from small scale solar (≤ 100 kW) as it is increasingly becoming a significant source of power in the NEM. But strictly speaking, rooftop solar is treated as negative demand rather than generation.
During 2018, electricity generated from variable renewable energy (wind, small scale solar, and large scale solar) accounted for 12.6% of total electricity generation in the NEM. This is approximately a 30% increase on 2017, when variable renewables represented 9.8% of generation. Fossil fuels, and in particular coal, still dominate generation in the NEM, accounting for almost 80% of all generation.
Exponential growth in large scale solar
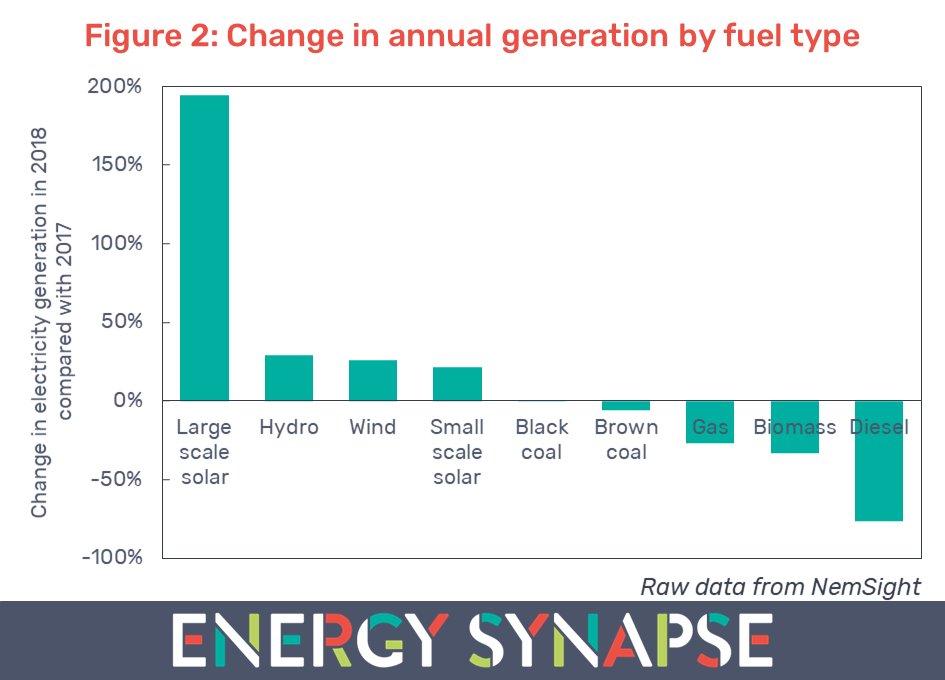
Figure 2 shows the percentage change in electricity generation for each fuel type in 2018 compared with 2017. The data in both Figures 1 and 2 is based on GWh generated rather than capacity. As can be seen in Figure 2, 2018 was the year of large scale solar. Generation from large scale solar almost tripled in 2018, completely eclipsing the growth in any other fuel type.
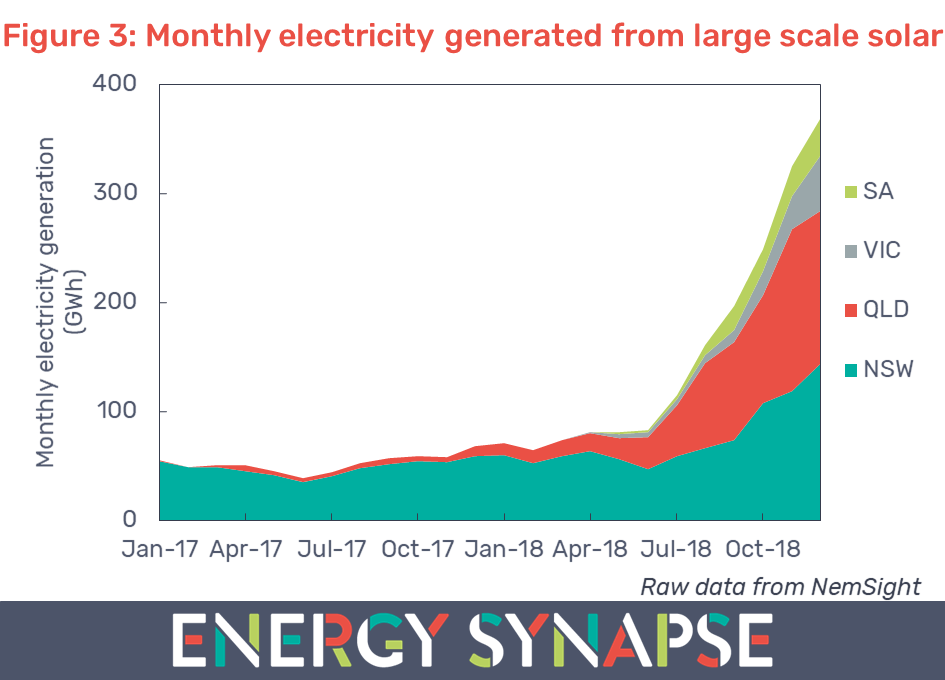
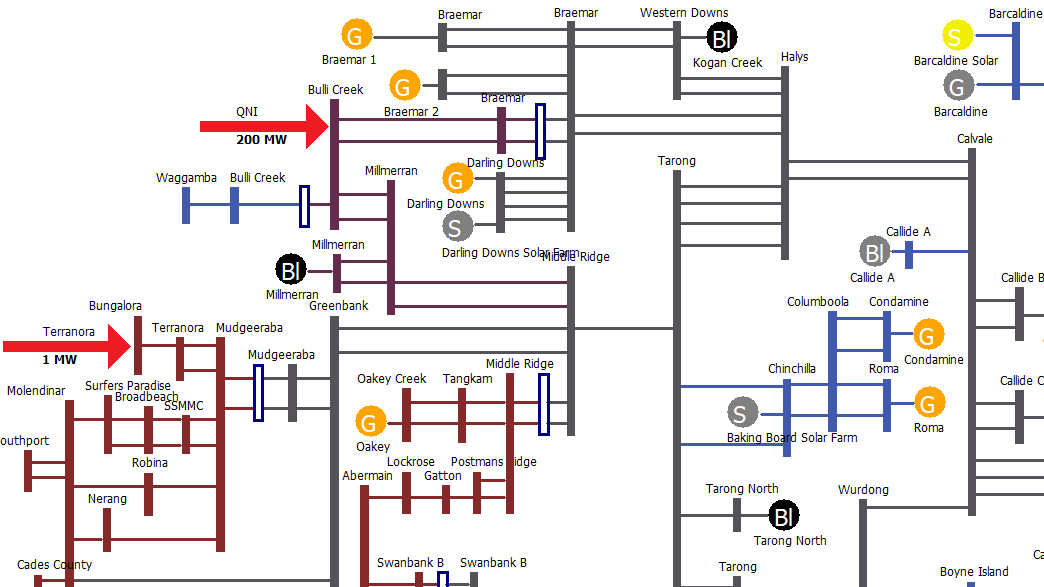
Large scale solar still only represents a very small portion (1%) of NEM generation. However, it has experienced extraordinary growth in the second half of 2018, as new capacity has come online (see Figure 3). The biggest growth has been in Queensland. In 2018, the electricity generated from large solar in Queensland was more than 14 times higher than in 2017.
Small scale solar has also seen strong growth, with the generation from these systems increasing by 21% in the NEM (see Figure 2). Queensland leads the nation in terms of both installed capacity of small solar (2220 MW) as well as having the highest percentage of dwellings with solar PV (33%) (Source: APVI). Furthermore, the statistics for 2018 will continue to grow as more systems are officially registered over the next 12 months.
The high growth in solar (both large and small scale) is already having a profound effect on wholesale electricity prices. In a previous article, we used Queensland as a case study to demonstrate how solar is pushing down daytime wholesale electricity prices. We are seeing daytime prices fall out of the top quartile of pricing and into the bottom quartile. This has big implications for developers of future solar projects, as they may see returns diminish.
Renewables (including hydro) are displacing higher priced gas generation
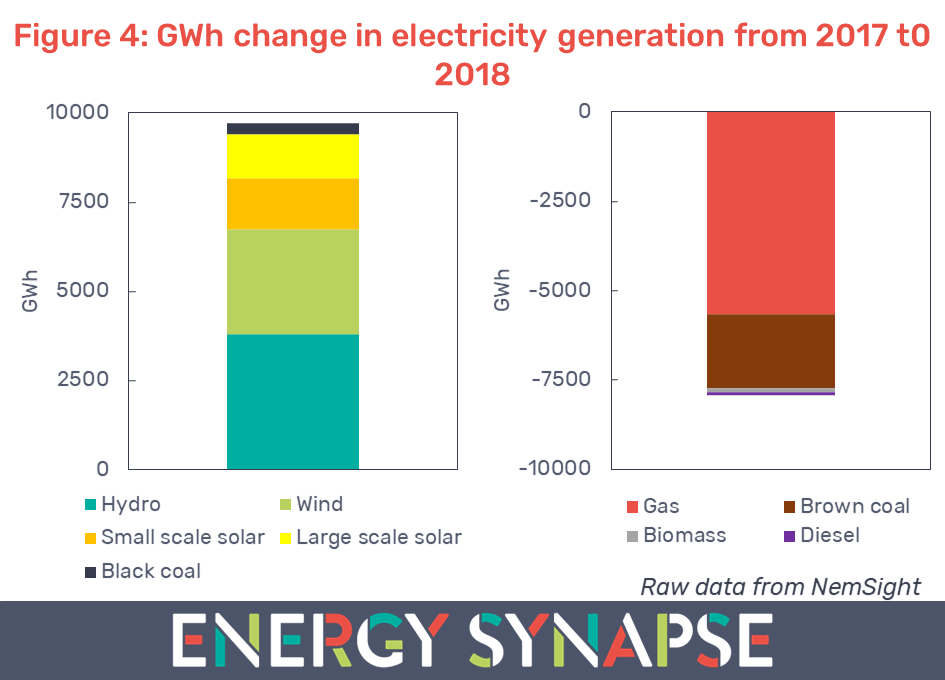
Figure 4 shows the change in electricity generation by each fuel type, but this time as a GWh change rather than percentage. The left hand side shows the fuel types that had an increase in generation. The right hand side shows the fuel types that had a decrease in generation. The difference between the two charts (approximately 1800 GWh) is the load growth in the NEM.
We can see that in absolute terms, gas generation was the biggest loser in the energy mix in 2018. Electricity from gas decreased by 5660 GWh (27%) across the NEM as a whole. The overall capacity factor for gas generation fell to just 16.6%, compared with 22.6% in 2017. There are several reasons for the reduction in gas generation:
1. Gas generation was less available throughout 2018.
2. The gas generation that was available, was bid in at higher prices to reflect the higher pricing in gas markets.
3. Existing hydro generation, especially in Tasmania, offered its capacity at much lower prices as we explained in part one. This is the main reason for the growth in hydro’s capacity factor from 17.3% in 2017 to 22.3% in 2018.
4. Wind and solar have a zero marginal cost and hence tend to bid into the wholesale market at ≤ $0/MWh. This means they are at the very bottom of the bid stack. The growth in renewables combined with hydro offering lower prices, meant that any available gas was increasingly squeezed out of the market.
Brown coal decreasing with closure of Hazelwood
Hazelwood, a 1600 MW brown coal fired power station in Victoria, was closed at the end of March 2017. As a result, brown coal generation fell by 18% in 2017 compared with 2016, and again by 6% in 2018.
Following the closure, existing coal fired power stations have picked up some of the slack. Even though total coal generation is down, the capacity factor for brown coal has increased from 72% in 2016 to 81% in 2018. The capacity factor for black coal has also increased from 61% in 2016 to 65% in 2018.
As more ageing fossil fuel generation exits the market, and more renewable energy comes online, we can expect the energy mix to keep evolving. Stay tuned for part three of our series…
Author: Marija Petkovic, Founder & Managing Director of Energy Synapse
Follow Marija on LinkedIn | Twitter
National Electricity Market year in review part 1/2: Wholesale electricity prices
January 8, 2019
Share
2018 has been another challenging year for the energy industry. Hopes of a national policy that merges energy and emissions were dashed with the collapse of Malcolm Turnbull’s leadership in August. Nonetheless, consumers, businesses and state governments are forging ahead with the energy transition. In this special two part blog series, we will be looking back at what all of this has meant for the National Electricity Market (NEM) over the past year. This is Part 1/2 where we will be focusing on wholesale electricity prices.
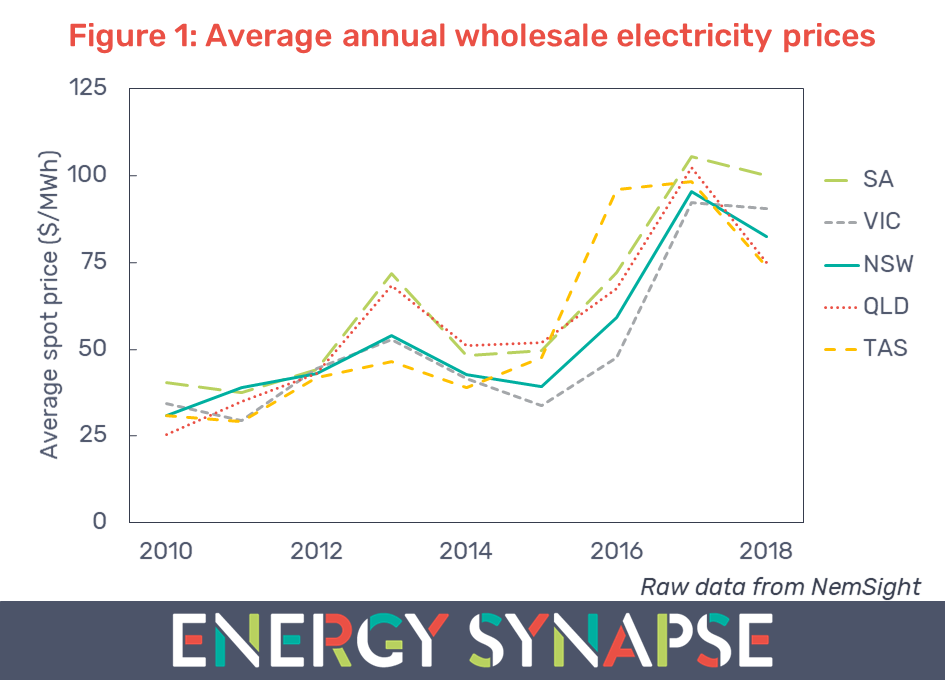
The National Electricity Market has been in the throes of an “energy crisis” for the last three years. The energy crisis has been brought about by a combination of factors coming together such as high gas prices, a decade of policy uncertainty, exit of ageing generation, a lack of competition, outdated market rules, and more. This has resulted in record high wholesale electricity prices.
Figure 1 shows the average annual wholesale electricity price for each state from 2010 to 2018. We have compiled this data using NemSight, a software developed by Creative Analytics (part of the Energy One group). As can be seen from Figure 1, wholesale electricity prices eased in 2018 in all states, which is welcome news for consumers. However, prices still remain at very high levels relative to historical values.
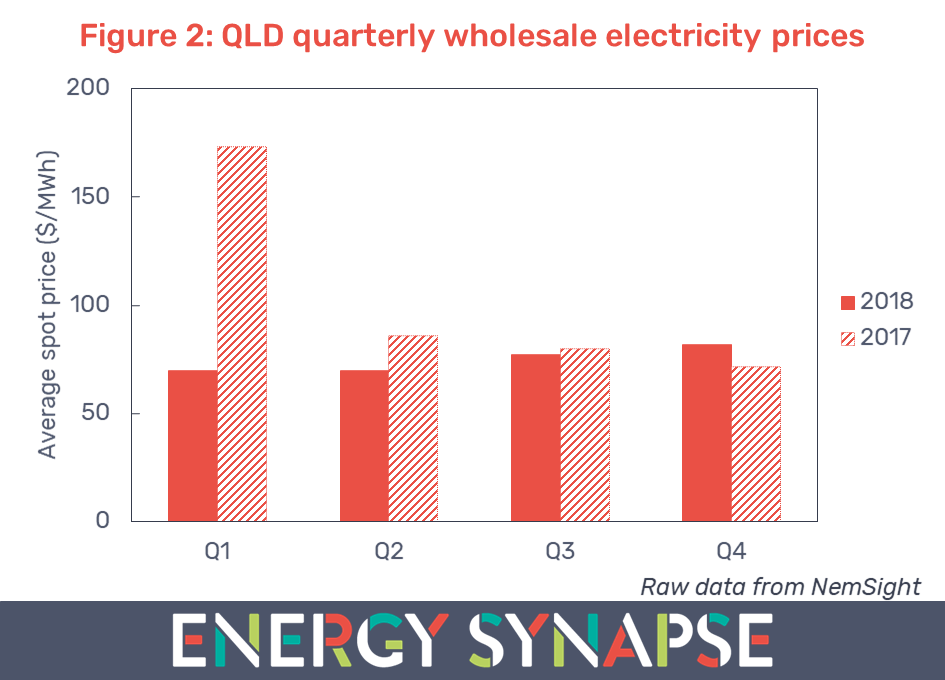
State Government action led to very sharp falls in Queensland wholesale electricity prices
Wholesale electricity prices in Queensland fell by 27% in 2018. This is the highest price reduction out of any state. Figure 2 shows that this can be attributed to the first quarter of the year (Jan to Mar). In 2018, the average Q1 price in QLD was less than half that in 2017 ($69.99/MWh compared with $173.20/MWh). This is despite the fact that the 2017 record for the highest ever electricity demand in QLD was broken four days in a row in February 2018.
This dramatic price decrease in the face of record high demand was largely due to the Powering Queensland Plan implemented by Queensland State Government. The QLD Government owns the majority of the generation in the state. As part of the Powering Queensland Plan, Stanwell Corporation’s (state owned entity) Swanbank E 385 MW gas fired power station was returned to service.
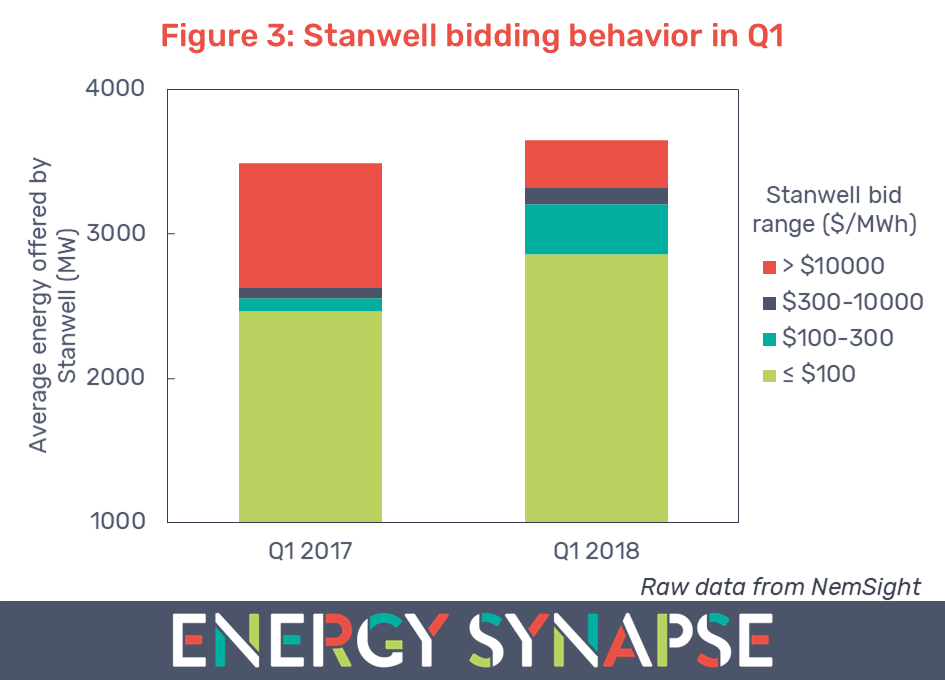
The QLD Government also directed Stanwell Corporation to alter their bidding practices to put downward pressure on wholesale electricity prices. Stanwell is the dominant player in the QLD market and has historically used its market power to raise prices and thereby increase profits. Consequently, this direction by the state government has had a significant impact on pricing.
Figure 3 shows how Stanwell’s bidding behaviour has changed in the first quarter of 2018 versus 2017. It shows the average amount of megawatts that Stanwell offered into the market for each 30 minute Trading Interval and the associated price bands. We can see that the total energy offered was higher in 2018, which can be attributed to the return of Swanbank E. But even more significant is the change in pricing. On average, Stanwell offered 655 MW of extra power at prices less than or equal to $300/MWh.
Higher availability of cheap hydro led to price falls in Tasmania
Tasmanian wholesale electricity prices fell by 25% in 2018, the second biggest fall in the NEM. The biggest price reductions occurred in the second and third quarter of 2018 as shown in Figure 4. Electricity demand tends to peak in Tasmania during this time. Figure 4 shows that peak demand was 4% lower in 2018 compared with 2017, which eased pressure on prices. However, the far bigger factor had to do with the bidding behaviour of hydro power.
State owned hydro generation has close to a complete monopoly over the Tasmanian market. Figure 5 shows the drastic change in bidding behaviour from April to September in 2018 versus 2017. In 2018, hydro power stations offered an average of 627 MW of extra power at a price of less than or equal to $100/MWh. This is significant in any market, but especially so in a small market like Tasmania.
Lower demand eased wholesale electricity prices in NSW
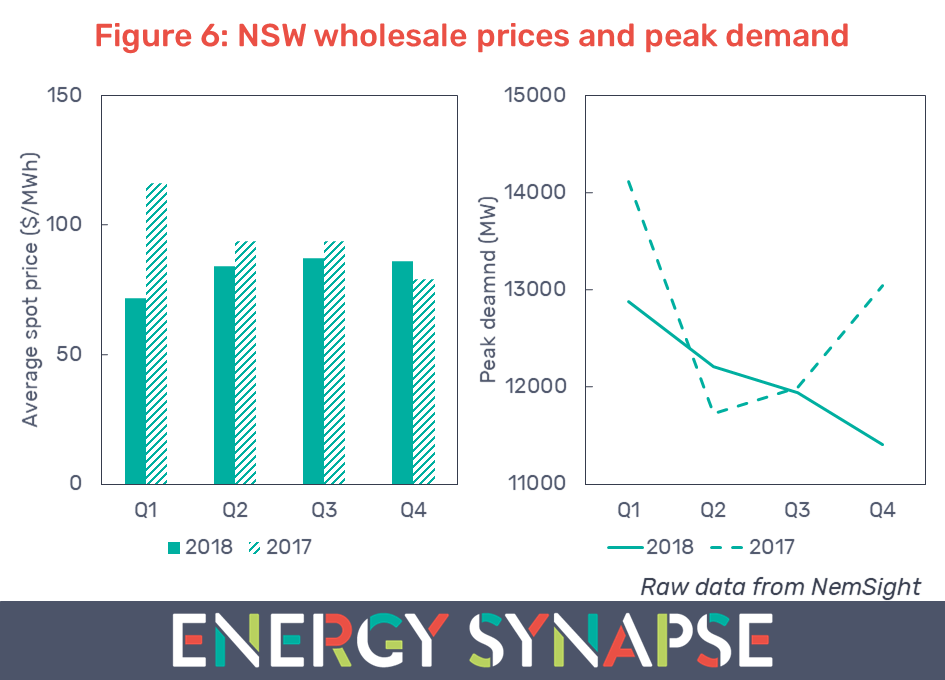
Wholesale electricity prices in NSW fell by 14% in 2018. Similarly to Queensland, the biggest price reduction occurred in Q1 (see Figure 6). The key drivers of the Q1 price decrease were:
(a) Lower demand predominately due to less extreme summer heat and to a lesser extent, growth in behind the meter solar PV. Peak demand in Q1 was 1230 MW (9%) lower than in 2017 (see Figure 6); and
(b) There were fewer periods where high temperature days in NSW coincided with severe weather in other regions.
Victoria and South Australia experienced only slight price reductions
Hazelwood, a 1600 MW brown coal fired power station in Victoria, was closed at the end of March 2017 on very short notice. This left many fearing the worst for Victoria and South Australia for the upcoming summer. AEMO acted swiftly to put together a summer readiness plan, which brought close to 2000 MW of additional resources into the NEM. This included procurement of 884 MW of demand response (with support from ARENA) through the Reliability and Emergency Reserve Trader (RERT), as well as making available previously mothballed gas generation such as Pelican Point in South Australia.
The result was that wholesale electricity prices actually dipped slightly over 2018. 5% in South Australia and 2% in Victoria. However, it should be noted that Victoria was the only state in the NEM to experience higher Q1 prices in 2018 (see Figure 7). As we previously reported, Victoria set a new record for the highest ever wholesale electricity prices during January. There was unusually hot weather and coal fired generation tripped. Unfortunately, all of this also coincided with low wind output. Similar weather conditions prevailed in South Australia, and with Victoria being South Australia’s only point of interconnection, both states experienced volatile pricing.
Nonetheless, without proactive action from AEMO, the situation could have been much worse. Maintaining system security and achieving an overall price reduction in both Victoria and South Australia, however slight, is the best result anyone could have hoped for.
Author: Marija Petkovic, Founder & Managing Director of Energy Synapse
Follow Marija on LinkedIn | Twitter