Clean energy potential in Toowoomba and the Surat Basin
September 1, 2022

The Toowoomba and Surat Basin region in southern Queensland is an energy powerhouse home to a diverse mix of resources including coal, gas, and renewables. As the uptake of renewable energy grows, this region has huge potential to be one of Australia’s clean energy capitals.
Fast facts about the Toowoomba and Surat Basin (TSB) region:
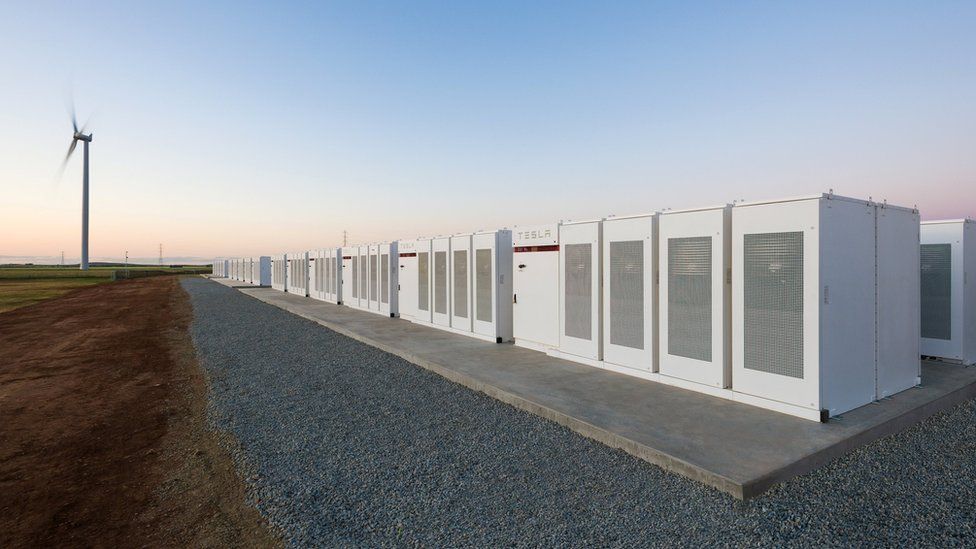
– TSB is home to half of the existing clean energy capacity in Queensland, including the biggest wind farm, solar farm, and battery in the state.
– Projects under development amount to five times the existing clean energy capacity in the region.
– TSB is close to major load centres. This contributes to high marginal loss factors (MLFs) for local generators.
– Sunny Queensland in general is a great area for solar. But what many might not be aware of is that the wind profile is very interesting as well.
The future is renewable
We are on the cusp of the biggest clean energy investment opportunity in a lifetime. The Toowoomba and Surat Basin region is extremely well placed to take advantage of this boom.
Data below from the Energy Synapse Platform shows power projects under development across the National Electricity Market (NEM) as well as specifically in the TSB region as at July 2022. As can be seen from the chart, fossil fuel projects represent a very small portion of all projects under development. When it comes to power generation, the future is very much renewable.

Why wind in the Surat Basin?
We probably don’t need to explain why companies would be interested in building solar farms in Queensland. However, some might be surprised to learn that this is a very interesting region for wind as well. For example, Coopers Gap Wind Farm in the Surat Basin was one of the best performing wind farms in the NEM in 2021.
At a high level, the wholesale value of a power generation asset is a result of two variables:
1. The amount of electricity the asset can produce; and
2. The value of that electricity in the energy market.
Coopers Gap Wind Farm did not produce an extraordinary amount of electricity. In fact, this wind farm had quite an average capacity factor throughout 2021. The reason it did better than most wind farms is almost entirely due to the pricing side of the equation.
Firstly, as can be seen from the chart below, Queensland has had the highest wholesale electricity prices out of any NEM region over the past year. This gives a significant advantage to any power stations that are located in Queensland. Furthermore, we anticipate that Queensland will experience above average volatility (compared to other states) over the next decade (particularly if AEMO’s Step Change scenario eventuates).

However, it is not just the average price that matters. Wholesale electricity prices change every five minutes in the NEM. Prices tend to be lowest in the middle of the day when solar PV (both utility-scale and rooftop) is generating large amounts of electricity. In contrast, electricity prices tend to be higher in the morning and evening when more gas and hydro is needed.
The chart below from the Energy Synapse Platform shows the average intraday capacity factor during 2021 for two wind farms: Coopers Gap and Yendon in Victoria. Yendon has quite a flat generation profile, which is typical for many wind farms in Victoria. In contrast, the wind resource at Coopers Gap dips in the middle of the day. This makes Coopers Gap very complementary to solar and well placed to take advantage of higher prices that tends to occur on the solar shoulder periods. This type of generation profile tends to be much more valuable in the wholesale market than a profile that it is relatively flat throughout the day.

Opportunities for battery storage
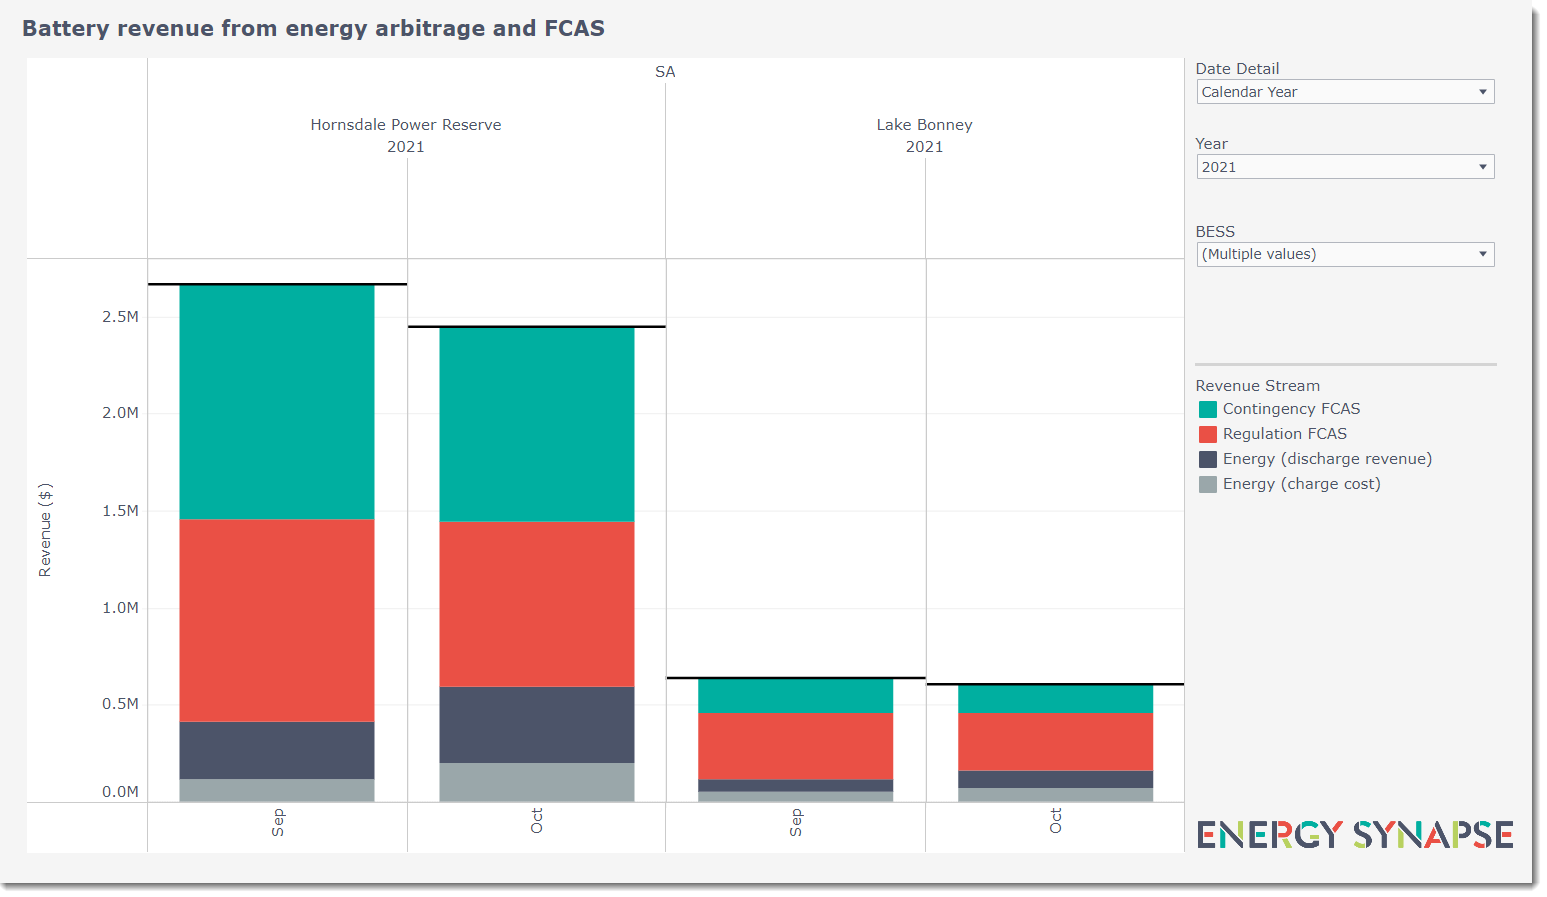
As the transition to clean energy continues, battery storage will become increasingly valuable in the market. This is because batteries are dispatchable and fast responding. A large portfolio of batteries will needed across the NEM, including the TSB region. Furthermore, there will be opportunities to repurpose existing grid infrastructure and install utility-scale batteries at many of the fossil fuel generators within the Surat Basin when they retire.
The energy mix is undoubtedly changing. This is creating a massive opportunity for the Toowoomba and Surat Basin region to secure its next stage of economic growth.
Author: Marija Petkovic, Founder & Managing Director of Energy Synapse
Follow Marija on LinkedIn | Twitter


