NEM wind and solar revenue falls in 12-months to August 2026
September 24, 2026
NEM wind and solar revenue from the spot market has fallen significantly in the 12-months to 31 August 2026, compared with the prior 12-month period, as more supply has come online and put downward pressure on wholesale energy prices.
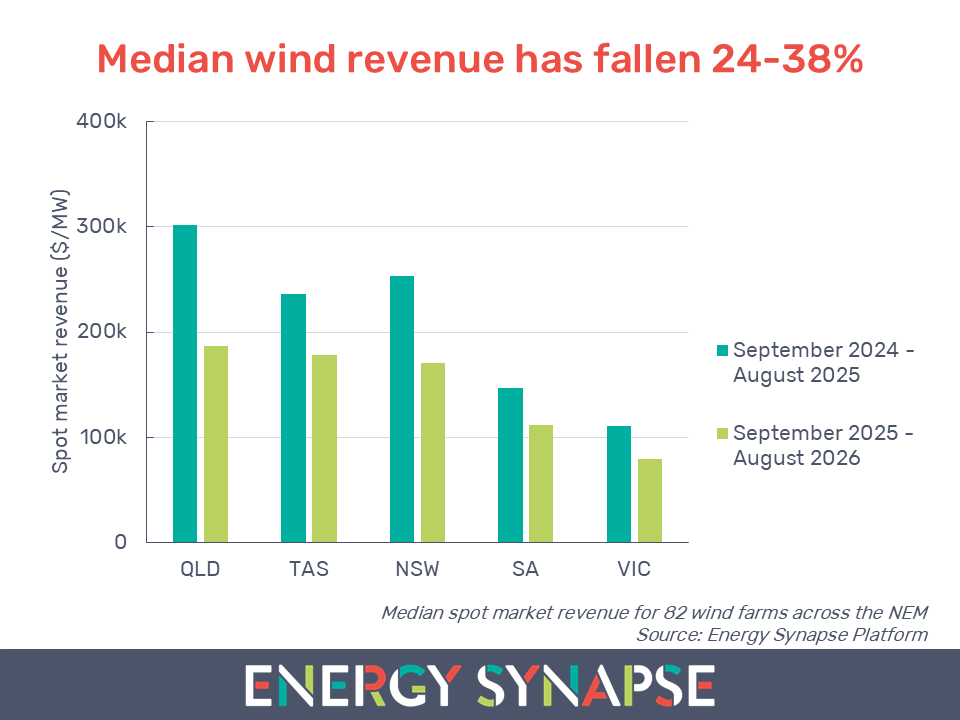
Revenue for wind farms has fallen 24-38% across the NEM
Data from the Energy Synapse Platform shows that the median wind revenue fell from:
- $302k to 187k per MW in Queensland (down 38%)
- $237k to $178k per MW in Tasmania (down 25%)
- $253k to $170k per MW in New South Wales (down 33%)
- $147k to $111k per MW in South Australia (down 24%)
- $110k to $79k per MW in Victoria (down 29%)
At a fleet level, the decline in revenue for wind farms was primarily driven by lower wholesale energy prices, rather than curtailment.
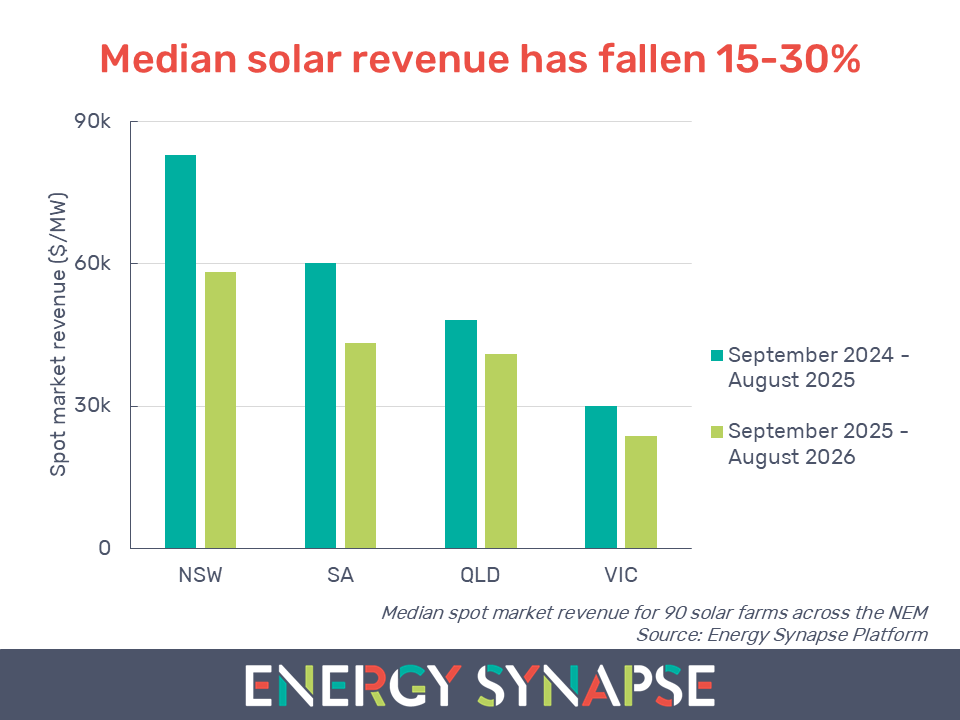
Revenue for solar farms has fallen 15-30% across the NEM
Data from the Energy Synapse Platform shows that the median solar revenue fell from:
- $82.9k to $58.2k per MW in New South Wales (down 30%)
- $60.2k to $43.3 per MW in South Australia (down 28%)
- $48.1k to 41.1k per MW in Queensland (down 15%)
- $30.0k to $23.7k per MW in Victoria (down 21%)
The decline in revenue for solar farms was mostly driven by lower capture prices, except for South Australia where higher curtailment was the key factor.
What drives individual asset performance?
In this article, we report the median (50th percentile) revenue achieved by wind and solar farms to give an indication of typical performance in each NEM region. However, even within the same NEM region, there can be significant variation in revenue performance on an individual asset level. This is due to factors such as operational strategy, marginal loss factors, grid constraints, and technology/age of the asset.
Subscribers to the Energy Synapse Platform can explore granular asset level performance for every utility-scale wind and solar farm registered in the NEM. The Energy Synapse Platform also maps the full pipeline of power projects under development.
Methodology for NEM wind and solar revenue analysis
The Energy Synapse Platform estimates the revenue earned by every utility-scale wind and solar farm across the NEM from the wholesale energy market using SCADA, market pricing data and site-specific marginal loss factors (MLFs). The revenue is normalised by the registered capacity of the asset.
To construct the analysis in this article, we only considered wind and solar farms that were operational over the full 24-month period from 1 September 2024 to 31 August 2026. This gave us a sample size of 90 solar farms and 82 wind farms.
The analysis in this article does not consider power purchase agreements (PPAs) or revenue from large-scale generation certificates (LGCs).
See our similar analysis for BESS revenue performance in 12-months to August 2026.